A mobile app investment is rarely rejected because the idea is weak. It is usually challenged because the financial case is not clear enough. For many businesses, a mobile app business case needs more than a cost estimate. It needs to show how the app will generate measurable value: new revenue, lower operating costs, stronger retention, and reduced business risk. Without that structure, the discussion stays subjective. With it, the board can test the assumptions, compare alternatives, and decide whether the investment deserves approval. The goal is not to make ROI look bigger than it is. The goal is to make the return visible enough to support a confident decision. This article will show you how to calculate mobile app development ROI, structure the value into measurable buckets, handle CFO objections, and connect the business case to vendor selection before you approve the investment.
For the broader planning view, the complete mobile app development guide explains how strategy, scope, architecture, team setup, security, and delivery decisions connect before a project reaches investment approval.
TL;DR
Mobile app development ROI measures whether the value your app creates in Year 1 is higher than the full cost of building, running, supporting, and securing it. The cleanest formula is: ROI (%) = ((Total Annual value delivered – Annual total cost of ownership) / total annual cost of ownership) × 100.
For most Dutch and European B2B companies, the return comes from four buckets: new revenue, operational efficiency, customer retention, and risk or compliance reduction. The strongest business case does not claim that “the app improves customer experience.” It shows what that improvement is worth in EUR.

Why strategic value is not enough for a CFO
A mobile app can improve customer experience, reduce friction, and strengthen a company’s digital channel. That does not make it an investable business case. A CFO does not approve “better engagement.” A CFO approves numbers that can be tested.
A weak business case says: This app will improve customer experience and make our services easier to access.
A stronger business case says: This app is expected to reduce inbound support calls by 25%, saving €58,500 in Year 1, and move 1,200 repeat orders from manual processing to self-service, creating another €42,000 in operational value. Against a Year 1 TCO of €95,000, the project has a Year 1 ROI of 5.8% and a payback period of 11.4 months.
That is the difference between a product argument and an investment case. This matters more in Dutch and European B2B settings because decision-makers often expect a clear method behind the numbers. If the assumptions are vague, the business case becomes easy to reject. If the assumptions are visible, the discussion becomes more useful: the board can challenge the inputs instead of rejecting the idea.
The mobile app development ROI formula
Use one primary formula for the business case: ROI (%) = ((Total value delivered – total cost of ownership) / total cost of ownership) × 100
The formula has two sides.
Total value delivered is the EUR value created across the ROI buckets that apply to your app: revenue, efficiency, retention, and risk reduction.
Total cost of ownership is the full annual cost of the app. It includes build cost, maintenance, hosting, infrastructure, support, security, compliance work, and expected change requests. For the build-cost input, use your vendor quote or the cost benchmark from How much does it cost to build a mobile app in 2026?. For costs that teams often miss, use Hidden costs of mobile app development as the TCO checklist.
A second formula helps the board understand timing: Payback period (months) = Total build cost / (Annual value generated / 12)
The ROI formula shows whether the investment creates value. The payback formula shows when the investment starts to return cash or cost savings.
Worked example
Assume an internal B2B app has:
| Input | Amount |
|---|---|
| Input | Amount |
| Initial build cost | €70,000 |
| Year 1 maintenance and support | €12,000 |
| Hosting and infrastructure | €6,000 |
| Security and compliance work | €7,000 |
| Expected change requests | €5,000 |
| Year 1 total cost of ownership | €100,000 |
| Year 1 value from efficiency savings | €82,000 |
| Year 1 value from risk reduction | €18,000 |
| Total Year 1 value delivered | €100,000 |
In this example: Year 1 ROI = ((€100,000 – €100,000) / €100,000) × 100 = 0%
That does not mean the project is weak. It means the app breaks even in Year 1. If the same app keeps generating efficiency value in Year 2 while build cost drops out of the denominator, the longer-term case becomes stronger. For first approval, the Year 1 view keeps the model conservative.
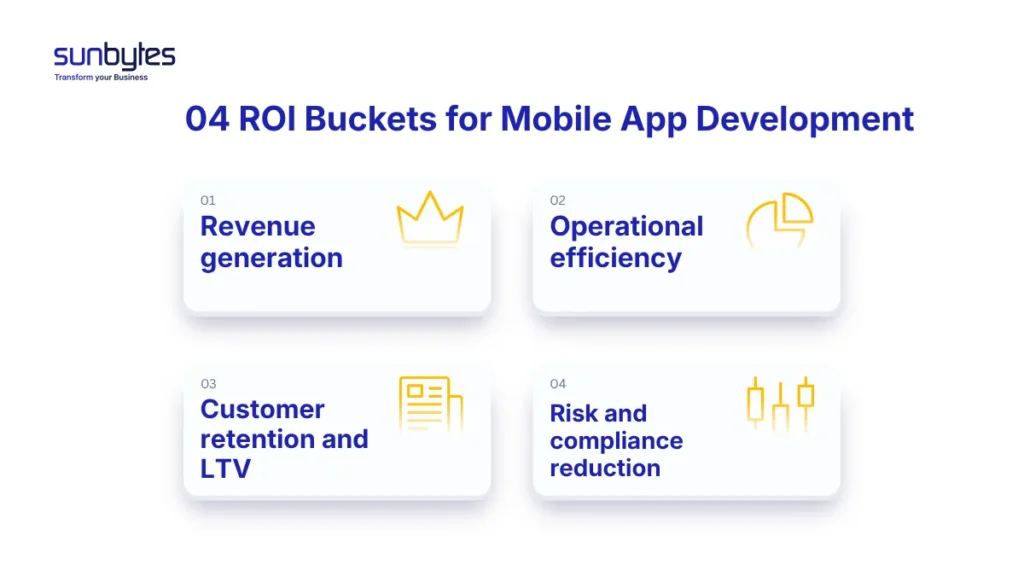
The four ROI buckets: where mobile apps generate measurable return
Not every mobile app creates value in the same way. A field-service app may create most of its ROI through efficiency. A customer portal may create value through self-service and retention. A commerce app may rely on direct revenue. Before writing the business case, choose the buckets that match your app type.
| ROI bucket | Typical measurable value | How to quantify it | Internal data needed |
| Revenue generation | New transactions, higher order value, upgrades, subscription revenue | Conversion rate × average order value × monthly volume × 12 | Current channel revenue, average order value, order volume |
| Operational efficiency | Fewer manual steps, fewer support calls, faster internal workflows | Hours saved × hourly cost × frequency | Process time, labour cost, transaction volume |
| Customer retention and LTV | Lower churn, higher repeat use, higher annual revenue per customer | Churn reduction × revenue per customer × customer base | Churn rate, ARR, customer base |
| Risk and compliance reduction | Lower expected cost from incidents, fines, manual compliance work | Estimated exposure × probability reduction | Risk exposure, current compliance cost, control gaps |
Bucket 1: Revenue generation
Revenue ROI applies when the app creates a measurable path to new or increased income. This is strongest for apps that support ordering, subscriptions, account upgrades, paid features, booking, or repeat purchases.
The revenue case usually comes from two sources.
- The first is new mobile revenue. This happens when the app creates transactions that were previously handled through a salesperson, website, phone call, or manual order form.
- The second is revenue uplift from better repeat behaviour. This happens when app users buy more often, renew faster, or use higher-value services than non-app users.
Use this formula: Annual revenue value = Monthly app transactions × Average order value × 12
A simple example:
| Input | Amount |
|---|---|
| Monthly app transactions | 250 |
| Average order value | €160 |
| Annual revenue value | €480,000 |
This does not mean the app creates €480,000 in net profit. The CFO will want to know whether these transactions are new, shifted from another channel, or cheaper to serve. If the app only moves existing web orders into a mobile interface, the revenue bucket is weaker. In that case, the value may sit in efficiency, retention, or lower service cost instead.
For EU market context, Eurostat reported that in 2024 EU enterprises generated 19.49% of total turnover from e-sales, with 8.39% coming through websites or apps. That does not prove ROI for your app, but it supports the idea that digital ordering channels are already part of European business revenue models.
Internal data you need:
- Current monthly order volume by channel
- Average order value or annual revenue per customer
- Expected number of transactions the app can influence
Bucket 2: Operational efficiency savings
Operational efficiency is often the strongest ROI bucket for B2B apps. It is also the easiest to underestimate because the return does not always look like revenue. It appears as fewer support calls, faster workflows, fewer admin hours, and lower dependency on manual coordination.
This bucket fits apps such as:
| App type | Efficiency source |
|---|---|
| Field-service app | Less manual reporting and faster job updates |
| Internal approval app | Shorter approval cycles and fewer email follow-ups |
| Customer self-service app | Fewer support calls and account-management requests |
| Sales enablement app | Faster quote access, product data, and order status checks |
Use this formula: Annual efficiency value = Hours saved per week × Hourly labour cost × 52
For the Netherlands, CBS reported that labour costs per hour worked rose from €42.5 in 2023 to €45.0 in 2024. That gives Dutch companies a useful baseline for modelling time savings in EUR, although each company should use its own fully loaded labour cost where possible.
Example:
| nput | Amount |
|---|---|
| Input | Amount |
| Hours saved per week | 35 |
| Hourly labour cost | €45 |
| Annual efficiency value | €81,900 |
The CFO will usually ask whether these savings reduce actual cost or only free up capacity. Both can be valid, but they should be labelled differently. If the app lets the company avoid hiring another support role, the value is hard cost avoidance. If it frees existing teams to handle more work, the value is productivity capacity. Do not mix the two in the model without explaining the difference.
Internal data you need:
- Number of hours currently spent on the process
- Fully loaded hourly cost for the people doing the work
- Expected reduction in manual work after launch
Need help mapping the right ROI buckets? If your mobile app business case depends on revenue, efficiency, retention, or risk reduction, Sunbytes can help you test which assumptions are strong enough for a CFO conversation. We help translate the business goal into measurable value buckets before the scope moves into vendor selection. Talk to Sunbytes about your mobile app ROI case.
Bucket 3: Customer retention and lifetime value
Retention ROI applies when the app makes it easier for customers to stay active, renew, reorder, or use the service more often. This bucket is strongest for subscription, account-based, membership, or recurring B2B models. The calculation starts with churn. Use this formula: Annual retention value = Churn reduction × Customer base × Annual revenue per customer
Example:
| Input | Amount |
|---|---|
| Customer base | 500 |
| Annual churn reduction | 2% |
| Customers retained | 10 |
| Annual revenue per customer | €6,000 |
| Annual retention value | €60,000 |
This bucket needs careful wording. The app rarely reduces churn by itself. It reduces churn when it improves a specific behaviour: faster ordering, clearer account access, easier service requests, better usage visibility, or more frequent customer touchpoints. A CFO will reject a retention claim if the assumption is “better app experience equals lower churn.” Make the mechanism clear. For example: Customers who can reorder in the app within two minutes are less likely to call support, delay purchases, or switch to a competitor with easier self-service. That is still an assumption, but it is testable.
Track leading indicators in the first 90 days after launch:
| App type | 90-day indicator |
|---|---|
| Self-service app | Active accounts using self-service features |
| Subscription app | 30-day and 60-day active usage |
| B2B ordering app | Repeat orders placed through the app |
| Support app | Reduction in repeat support tickets |
Internal data you need:
- Current churn rate
- Annual revenue per customer
- Customer segment most likely to use the app
Bucket 4: Risk and compliance cost reduction
Risk and compliance value should be included in the ROI model when the app reduces a measurable exposure. This can include lower manual compliance effort, better consent capture, cleaner audit trails, lower incident probability, or reduced reliance on insecure manual workflows. This bucket matters for apps that process personal data, payment data, health data, employee data, location data, or customer account data.
Use this formula: Annual risk reduction value = Estimated exposure × Probability reduction
A more practical version is: Annual risk reduction value = Compliance hours saved + Expected incident cost reduction + Expected regulatory exposure reduction
The key word is expected. You are not saying the app “saves a fine.” You are saying better controls reduce the probability or cost of a known risk.
For GDPR, Article 83 includes administrative fines up to €20 million or 4% of total worldwide annual turnover for certain infringements, whichever is higher. The European Data Protection Board’s Guidelines 04/2022 on the calculation of administrative fines state that GDPR fine calculations are case-specific and must be effective, proportionate, and dissuasive, within the limits of Article 83.
Dutch enforcement also makes this risk real for companies operating in the Netherlands. The Dutch Data Protection Authority fined Netflix €4.75 million in 2024 for not properly informing customers about personal data processing.
Example:
| Input | Amount |
|---|---|
| Current compliance work | 20 hours/month |
| Internal compliance hourly cost | €70 |
| Annual compliance effort | €16,800 |
| Expected reduction from app controls | 40% |
| Annual compliance value | €6,720 |
This is a small number compared with revenue, but it becomes stronger when combined with risk exposure. If the app replaces spreadsheets, email attachments, manual consent tracking, or poorly governed data access, the business case can include expected risk reduction.
ENISA’s SME cybersecurity work also supports the business relevance of this bucket: in its SME research, 90% of surveyed SMEs said cybersecurity issues could seriously affect their business within a week, and 57% said they would most likely become bankrupt or go out of business after serious issues.
Internal data you need:
- Current cost of compliance tasks
- Personal data or regulated data processed by the app
- Current control gaps the app would reduce
If your app processes personal data, the ROI model should not treat compliance as a late-stage legal check. The GDPR compliance requirements for mobile apps help define which data protection obligations may affect consent, storage, access control, audit trails, and support cost. Not every app needs all four buckets. A field-service app may justify itself through efficiency. A customer portal may combine efficiency and retention. A commerce app may rely on revenue, but only if the conversion assumptions are credible.
Payback period scenarios for Dutch and European B2B apps
Payback period gives the board a simpler question than ROI: When does the investment recover its build cost? The answer depends on app type, scope, adoption, and value bucket mix. The figures below are illustrative and should be replaced with your own cost estimate, Sunbytes delivery input, or a vendor quote.
| App type | Illustrative build cost | Annual value | Payback period | Main ROI bucket |
|---|---|---|---|---|
| App type | Illustrative build cost | Annual value | Payback period | Main ROI bucket |
| Internal B2B workflow app | €45,000-€70,000 | €55,000-€85,000 | 10-16 months | Operational efficiency |
| Customer-facing self-service app | €80,000-€120,000 | €90,000-€130,000 | 11-16 months | Revenue + efficiency |
| Mobile commerce or subscription app | €120,000-€200,000 | €140,000-€240,000 | 10-17 months | Revenue + retention |
These ranges should not be copied into a business case without validation. Use them to structure the conversation, then replace them with project-specific inputs.
Handling common CFO objections
- “The projected benefits are too speculative.”
The CFO is not rejecting the app. They are rejecting assumptions they cannot verify. The fix is to split the ROI model into three scenarios:
| Scenario | How to model it |
|---|---|
| Conservative | Lowest credible value for each ROI bucket |
| Base | Expected value based on current process data |
| Optimistic | Higher adoption or stronger revenue impact |
Lead with the conservative case. If the project still works under conservative assumptions, the board discussion becomes easier.
For example, do not present “30% support reduction” as a single claim. Present 10%, 20%, and 30%. Then show what each scenario means in EUR.
- “We will not know the return until after the app is launched.”
That is partly true. The final ROI only becomes visible after users adopt the app.
But the business case can still define early proof points. A good mobile app ROI model includes 90-day indicators that show whether the long-term case is on track.
| ROI bucket | 90-day proof point |
|---|---|
| Revenue | App conversion rate, repeat order volume |
| Efficiency | Support calls reduced, hours saved |
| Retention | Active users, repeat usage, renewal signals |
| Risk | Fewer manual compliance steps, cleaner access logs |
These indicators do not replace ROI. They help the business decide whether to continue, adjust, or stop further investment after launch.
- “This budget could create more value elsewhere.”
This is an opportunity-cost objection. The CFO is comparing the app against other uses of the same budget: sales headcount, marketing spend, process automation, infrastructure, or another product initiative.
Answer it directly. If €100,000 spent on mobile app development can reduce annual operational cost by €80,000 and generate €40,000 in additional customer value, the Year 1 value is €120,000. That is a stronger case than a vague comparison against “digital innovation.” The app does not need to beat every investment option. It needs to show why this investment is the right one for the business goal.

How to prepare the ROI model before vendor selection
The ROI model should be built before signing with an app development agency. If you wait until after vendor selection, the business case often becomes shaped around the vendor’s proposal instead of the business outcome. Before signing, prepare five inputs:
| Input | Why it matters |
|---|---|
| Why it matters | |
| Target business outcome | Defines which ROI buckets matter |
| Current process cost | Supports efficiency calculations |
| Current channel revenue | Supports revenue calculations |
| Current churn or retention data | Supports LTV calculations |
| Risk and compliance exposure | Supports risk-reduction value |
Once the ROI assumptions are clear, the next step is to turn them into scope language a vendor can estimate accurately. A structured way to write your mobile app development brief helps connect business outcomes, user flows, data requirements, integrations, security expectations, and success metrics before proposals are compared.
ROI does not end at approval. It depends on whether the vendor can deliver the scope without uncontrolled rework, weak architecture decisions, or late security fixes. Explore How to choose a mobile app development company in Europe.
How Sunbytes helps turn ROI into a delivery plan
A mobile app ROI model is only useful if the delivery plan can protect it. If the project starts with unclear scope, weak governance, or security decisions left until the end, the ROI assumptions will drift before the app reaches launch.
Sunbytes helps Dutch and European companies turn approved mobile app investments into delivery plans that can be executed. That means translating the business case into scope, architecture decisions, team structure, sprint governance, and secure-by-design controls before development starts. Read the mobile app development process from brief to launch to discover how discovery, scoping, design, development, testing, launch, and post-launch iteration protect the assumptions behind the business case.
Why Sunbytes?
Sunbytes is headquartered in the Netherlands with a delivery hub in Vietnam. With 15+ years of experience and 300+ projects delivered, the team brings both European working principles and practical engineering capacity to mobile app projects that need cost control, security discipline, and delivery accountability.
- Digital Transformation Solutions: We design, build, modernize, test, and maintain digital products with senior engineering teams, so your mobile app business case can move from approved scope to working product without losing control over quality, architecture, or delivery.
- CyberSecurity Solutions: We reduce delivery risk by embedding practical security services and compliance readiness into the build, helping mobile app projects address data protection, access control, and audit expectations before they become late-stage blockers.
- Accelerate Workforce Solutions: We help companies scale delivery capacity with recruitment and workforce support when the approved roadmap needs more capability than the internal team can provide alone.
Ready to turn your mobile app business case into a delivery plan? Talk to Sunbytes about your app scope, ROI assumptions, security requirements, and team model before development starts.
FAQs
Calculate mobile app development ROI by comparing Year 1 value against Year 1 total cost of ownership. Use this formula: Year 1 ROI (%) = ((Total Year 1 value delivered – Year 1 TCO) / Year 1 TCO) × 100. Value should include revenue, efficiency savings, retention impact, and risk or compliance reduction where relevant.
Year 1 TCO should include initial build cost, maintenance, hosting, infrastructure, support, security work, compliance work, and expected change requests. Build cost alone is not enough because the app still needs to run, stay secure, and adapt after launch.
A good ROI depends on the app type and value bucket mix. Internal B2B apps may have lower direct revenue but strong efficiency savings. Commerce or subscription apps may show stronger revenue upside, but only if conversion and adoption assumptions are credible.
Use an efficiency formula: hours saved per week × fully loaded hourly cost × 52. For example, if an app saves 30 hours per week and the hourly labour cost is €45, the annual efficiency value is €70,200.
Yes, if the app reduces a measurable risk or compliance cost. Model it as expected risk reduction, not as a guaranteed saving. Use current compliance hours, risk exposure, incident probability, and control improvements to estimate the value.
Start with Year 1 ROI to test whether the app can justify the initial investment. If the CFO needs a longer view, convert the same value buckets into a three-year cash flow model and discount future value using the company’s internal finance assumptions.
Build the ROI model before signing with a vendor. The model helps define scope, success metrics, and vendor evaluation criteria. It also protects the project from becoming a feature list without a financial reason behind it.
Let’s start with Sunbytes!
Let us know your requirements for the team and we will contact you right away.