
The impact of employee bonuses on company performance is determined by design, not budget. Replacing the staff they retained would have cost more than 15% of the same payroll base. The bonus program succeeded because the design matched the outcome the company needed. Sunbytes works with international companies to structure workforce compensation that connects to measurable business outcomes.
TL;DR
- Employee bonus impact at the company level is not the same as employee satisfaction with bonuses. A bonus program can score high on employee surveys and produce zero movement in output, retention, or cost efficiency. The design determines the outcome. The budget determines only the scale.
- The evidence on how employee bonuses affect company performance is conditional. Gallup 2024 research on employee engagement shows that recognition and incentive programs lift output by 14% to 22% when the incentive is tied to a specific behavior or outcome that the employee controls directly. Programs tied to company-wide metrics the employee cannot influence produce no measurable productivity effect.
- The Dutch manufacturer’s result, 22% turnover reduction and 14% output increase at 6.8% of payroll, is replicable when three conditions are met: the bonus target is within the employee’s control, the payout is close in time to the behavior that earned it, and the program applies consistently across the team rather than selectively to individuals.
What employee bonus impact means at the company level
“Employee bonus impact is the measurable change in productivity, retention, and cost efficiency that a bonus program produces at the company level, distinct from employee satisfaction with bonuses, which is a separate dimension.”
Understanding how employee bonus impact works at the company level requires tracking three dimensions simultaneously: productivity (does output change?), retention (does turnover fall?), and cost (does the program return more than it costs?)

A company that introduces a retention bonus and tracks whether the retained employees stay is measuring one dimension. It is not measuring whether those employees are more productive, or whether the cost of the bonus is lower than the cost of replacing them. A bonus program that retains low-performers at above-market cost is performing worse than no program at all.
Why bonus programs succeed at some companies and fail at others
The single most consistent predictor of bonus program success is the proximity between the behavior rewarded and the payout. A quarterly team bonus paid within 30 days of the quarter closing reinforces the specific behaviors that drove the outcome. An annual bonus paid 10 months after the performance period ends does not. The employee cannot draw a reliable causal connection between what they did in January and the payment they receive in November.
The second predictor is employee control over the outcome. A bonus tied to company-wide profit for a warehouse team is a lottery, not an incentive. The warehouse team’s output has negligible effect on company profit and the team knows it. The result is that the bonus is perceived as a benefit (received when times are good) rather than an incentive (received when specific behavior occurs). Benefits affect satisfaction. Incentives affect behavior. These are not the same outcome.
Short-term vs long-term bonus impact: what the evidence shows
Deloitte’s 2023 Global Human Capital Trends survey found that 79% of executives rate recognition and reward programs as important to business performance, but only 38% rate their own programs as effective. The gap between importance and effectiveness is not a budget problem. The average bonus spent in the survey was 5.6% of payroll for non-sales roles (WorldatWork 2024).
Short-term bonuses (quarterly) produce faster behavioral change and clearer attribution. Employees understand what they are being rewarded for. The payout timing reinforces the connection. Long-term bonuses (annual, multi-year retention) produce stronger retention effects but weaker productivity effects, because the time horizon is too long to drive daily behavior.
The evidence suggests that combining short-term and long-term bonus structures produces the strongest combined outcome: short-term targets drive productivity quarter by quarter, while the long-term component creates the retention anchor that keeps top performers in place across years.
Types of bonuses and their impact differences
Not all bonus structures produce the same employee bonus impact. The design determines which outcome dimension is most likely to move. The table below maps the three main design variables to their primary impact.
| Bonus type | Primary impact | Time to impact | Design risk |
|---|---|---|---|
| Individual performance bonus | Productivity increase for high performers | 1 to 2 cycles | Peer resentment, reduced collaboration, gaming of metrics |
| Team-based bonus | Collaboration, group output, retention | 2 to 3 cycles | Free-rider risk if team is too large or output unmeasurable |
| Quarterly bonus | Short-cycle behavior change | Immediate, within cycle | Focus on short-term at expense of longer strategic priorities |
| Annual performance bonus | Retention, year-end output surge | 6 to 12 months | Long attribution gap reduces daily behavior impact |
| Retention bonus | Retention of specific individuals | Point-in-time | Retains individuals regardless of performance; can demotivate high performers not included |
| Non-cash recognition | Engagement, perceived fairness | Immediate | High individual variability; what one person values another does not |
Individual vs team-based bonuses
Individual performance bonuses produce the strongest short-term output increases for roles where individual contribution is directly measurable and independent: sales quotas, piece-rate production, billable hours. They create problems in roles where output is collaborative or where metric selection is imperfect.
Team-based bonuses produce stronger retention and collaboration outcomes. The Dutch manufacturer’s team-based quarterly structure produced a 14% output increase at the team level without the peer-comparison dynamic that individual bonuses create in manufacturing environments. The trade-off is that the free-rider risk must be managed: if team size is too large or the performance metric is too distant from individual contribution, the incentive effect dilutes.
Short-term (quarterly) vs long-term (annual, retention bonus)
A quarterly bonus with a 30-day payment window after quarter close creates the strongest behavioral signal. The employee experiences cause and effect within a single quarter. The behavioral change is reinforced four times per year rather than once. The cost of the program distributes evenly across the year, which makes budget management more predictable.
An annual bonus creates a stronger retention effect than a quarterly one. An employee who expects a significant annual payment in March is less likely to leave in November than an employee whose next bonus payment is three weeks away. The long-term retention bonus, often structured as a cliff-vest payment after 12 to 24 months of service, is the most focused tool for retaining specific individuals through a defined transition period.
Cash vs non-cash bonuses
Cash bonuses are the most straightforwardly valued by employees across all income levels and geographies. Non-cash recognition, additional leave, professional development funding, or experience-based rewards have high individual variability: the same reward is perceived very differently depending on the employee’s personal circumstances, values, and life stage.
Non-cash programs have a role in recognition frameworks for behaviors that are difficult to quantify and therefore difficult to assign a financial reward to. They do not substitute for cash bonus programs when the goal is to move productivity or retention metrics. For a CFO evaluating bonus program ROI, cash programs are more measurable and more defensible in a cost-benefit analysis.
How employee bonuses affect productivity
The employee bonus effect on productivity is real and measurable, but conditional. Gallup’s 2024 workplace research shows that engaged employees produce 23% higher profitability and 18% higher productivity than disengaged peers. Recognition and incentive programs are among the most consistent drivers of engagement when they are correctly designed.
For companies evaluating how bonuses fit into a broader workforce strategy, the guide to strategic workforce and talent planning covers how incentive design connects to workforce planning across markets and hiring cycles.

Which bonus structures are linked to measurable output increases
The bonus structures with the strongest evidence for measurable output increases share three characteristics: the metric is within the employee’s direct control, the payout is proximate in time to the performance, and the program is applied consistently so that employees understand the relationship between behavior and reward.
In manufacturing, piece-rate and team output bonuses tied to weekly or monthly production targets produce measurable output increases within the first two cycles. In professional services, individual quarterly bonuses tied to billable output or project-delivery milestones yield similar results. Where output in roles is harder to isolate, the effect is smaller and takes longer to appear.
The Dutch manufacturer’s 14% output increase appeared in the third quarter after program launch, which reflects the standard time-to-impact pattern: the first cycle establishes understanding of the program, the second cycle tests it, and the third cycle shows the behavioral change at scale.
When bonus programs reduce productivity, and why
Three design failures reduce productivity rather than increase it. The first is metric selection that rewards individual performance on a dimension that requires collaboration. When employees compete for individual bonuses in a team environment, they reduce information sharing, avoid assisting colleagues who might outperform them, and in some cases, game the reported metric. The output of the team declines even as the measured individual metric improves.
The second is threshold design that creates a cliff effect. A bonus that pays at 100% of target and zero below that creates an end-of-period behavior pattern: employees who are below target in the last two weeks of the cycle either make up the shortfall through sustainable effort or stop trying and coast. Employees above target stop pushing because additional output earns nothing. The result is a step-function output pattern that distorts production scheduling.
The third is frequency that is too low to drive behavior. An annual bonus that depends on outcomes over a 12-month period does not change daily decisions. The attribution gap is too wide. The employee cannot draw a credible line between choosing to work late on a Tuesday in February and the payment they receive the following December.
The time-to-impact problem: why most bonuses take 2 to 3 cycles to show results
Companies that introduce a bonus program and evaluate it after one cycle typically conclude that it does not work. They are evaluating too early. The impact of a bonus program follows a predictable pattern: cycle one establishes understanding, cycle two tests credibility (employees verify that the bonus is actually paid as described), and cycle three shows the behavioral change as employees begin to align their decisions with the incentive structure.
Evaluating a bonus program after one cycle is equivalent to evaluating a sales hire after one month. The measurement period is too short to reflect the actual effect. The Dutch manufacturer’s results appeared in month 12, after three quarterly cycles. An evaluation at month four would have shown minimal change.
Employee bonus impact on retention and turnover cost
Bonus impact on retention is the dimension where programs produce the clearest financial return, because the alternative cost is quantifiable. When a bonus program reduces voluntary turnover by 22%, the financial return is the cost of replacing 22% of the workforce that was not replaced. That cost is not the recruiting fee. It is the full replacement cost: external sourcing, internal HR time, onboarding, productivity ramp-up, and the institutional knowledge that was left with the departing employee.
The full cost breakdown of compensation and benefit components that contribute to retention is covered in the guide to total cost of employee benefits.
How bonuses affect voluntary turnover rates by employee segment
Bonus programs do not affect all employee segments equally. The segments most responsive to bonus-driven retention are: high performers in the top 20% of contribution who have external market options, employees in the 24 to 48-month tenure range who have accumulated institutional knowledge but have not yet made a long-term commitment to the employer, and employees in markets where compensation transparency is high and alternative offers are visible.
The segments least responsive to bonus retention are: employees who are leaving for non-compensation reasons (management, culture, growth opportunity), employees at the bottom of the performance distribution who are likely to leave regardless of pay level, and employees in markets where the bonus structure is already at or above market benchmark.
For international companies operating in Vietnam, the most responsive segment to bonus retention programs is mid-level technical talent in the 18- to 36-month tenure range. This cohort has completed the productivity ramp-up and represents the highest replacement cost. A retention bonus structure that triggers at 18 months and vests at 36 months addresses this segment directly.
How to calculate the retention ROI of a bonus program (3 steps)
Retention ROI is calculated by comparing the cost of the bonus program against the cost of the turnover it prevents. The calculation has three steps.
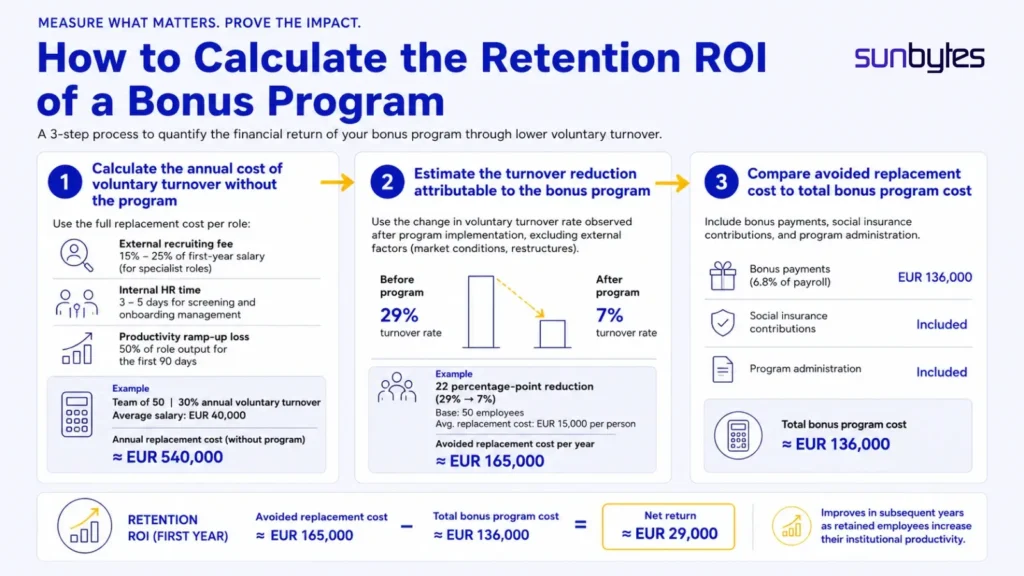
Step 1: Calculate the annual cost of voluntary turnover without the program. Use the full replacement cost per role: external recruiting fee (typically 15% to 25% of first-year salary for specialist roles), internal HR time (typically 3 to 5 days for screening and onboarding management), and productivity ramp-up loss (typically 50% of role output for the first 90 days). For a team of 50 employees with 30% annual voluntary turnover and an average salary of EUR 40,000, the annual replacement cost is approximately EUR 540,000.
Step 2: Estimate the turnover reduction attributable to the bonus program. Use the change in voluntary turnover rate observed after program implementation, excluding external factors such as market conditions and company restructures. The Dutch manufacturer reduced turnover from an estimated 29% to 7%, a 22-percentage-point reduction on a base of 50 employees at average annual replacement cost of EUR 15,000 per person. The avoided replacement cost was approximately EUR 165,000 per year.
Step 3: Compare avoided replacement cost to total bonus program cost. Total bonus program cost includes the bonus payments (6.8% of payroll), social insurance contributions on the bonus amount, and program administration. At 6.8% of a EUR 2,000,000 payroll, the total bonus cost was approximately EUR 136,000. The return was EUR 165,000 in avoided replacement cost. Net return: EUR 29,000 in the first year, improving in subsequent years as the retained employees increase their institutional productivity.
Which employee segments respond most strongly to bonus-driven retention
The segments with the strongest response to retention bonuses are those where the external market is active and the internal replacement cost is highest. In practice, this means: senior technical specialists in technology, finance, and engineering where the external market offers frequent alternatives, mid-career professionals in their second or third role who are in peak earning and mobility years, and employees in markets with low unemployment where employer competition for their profile is high.
The segments with the weakest response are those whose primary motivation for staying or leaving is not compensation-related. A talented product manager leaving because she has no growth path will not stay for a 10% annual bonus. A retention program that does not address the actual leaving reason produces cost without result.
The cost structure: what employee bonus programs actually cost
The visible cost of a bonus program is the payout. The employee bonus cost to the company is the full cost: payout plus social insurance contributions, administration, and opportunity cost of the budget. For companies measuring bonus program ROI across multiple markets and segments, Digital Transformation Solutions builds the data architecture that connects payroll outputs to performance and attrition data, which makes the five-question diagnostic later in this article answerable from company data rather than estimate.
The full taxonomy of mandatory and supplemental employee benefits, including how bonus programs interact with statutory obligations, is covered in the guide to types of employee benefits.
Direct bonus cost as a percentage of total payroll
When measuring employee bonus impact against cost, WorldatWork 2024 data provides the baseline: median bonus spend across non-sales roles is 5.6% of total payroll. The range is 2% to 12% depending on industry, company size, and the role of variable pay in the compensation philosophy. Technology companies and financial services companies tend toward the higher end. Manufacturing and logistics tend toward the lower end, with the Dutch manufacturer’s 6.8% sitting above median for its sector.
The benchmark matters for budget calibration, not for program design. A 5.6% spend on a poorly designed program produces less return than a 3% spend on a well-designed one. The question for a CFO is not “are we spending the right percentage?” but “is the program we are spending on producing measurable return on at least two of the three dimensions: productivity, retention, and cost efficiency?”
Tax and social insurance implications of different bonus structures
Bonus payments are treated as salary income in most jurisdictions and are subject to income tax withholding and employer social insurance contributions. In the Netherlands, employer social insurance contributions run approximately 20% to 25% of the bonus amount. In Vietnam, employer SHUI contributions under Decree 143/2018/ND-CP apply to bonus amounts that are included in the labor contract as regular supplementary payments. One-time discretionary bonuses not specified in the contract are exempt from SHUI but are still subject to PIT withholding.
The structural implication is that a EUR 10,000 bonus in the Netherlands costs the employer approximately EUR 12,000 to EUR 12,500 after social contributions. A VND 10,000,000 bonus in Vietnam that is contractually specified costs the employer an additional 21.5% in SHUI on top of the payout. A discretionary bonus of the same amount costs only the PIT withholding, which is borne by the employee. The structuring decision affects total program cost by 15% to 25% at scale.
When a bonus program costs more to run than it returns in performance
A bonus program produces a negative return when any of the following are true: the payout is made regardless of performance outcome (a guaranteed bonus is a salary increase with a different label), the retention effect is zero because the employees retained are not the ones the company needs to retain, the productivity effect is zero because the metric selected is not within employee control, or the total cost including administration and social contributions exceeds the value of the output improvement.
The test is straightforward. If voluntary turnover has not changed in the 12 months since program launch, and output per employee has not changed, and you cannot attribute any cost saving to the program, the program is a cost with no return. The correct response is redesign, not termination, because the productivity and retention potential is real. The design is the failure, not the concept.
If your bonus program is not moving retention or performance numbers, Sunbytes works with international companies to match compensation design to measurable workforce outcomes, across Vietnam, the Netherlands, and EU markets.
Explore Accelerate Workforce Solutions
When employee bonus impact creates value and when it does not
The same bonus budget produces different outcomes depending on design quality and organizational conditions. Four scenarios cover the range.
| Scenario | Outcome | Why |
|---|---|---|
| Well-designed bonus in a high-trust, aligned culture | Productivity increase of 10 to 22% (Gallup 2024). Turnover reduction of 15 to 25%. Positive ROI in 12 to 18 months. | Employees understand and trust the program. The metric is within their control. The payout timing reinforces the behavior. |
| Well-designed bonus in a low-trust or misaligned culture | Limited productivity impact. Moderate retention effect. Employees participate but engagement remains low. | The incentive structure is sound but cultural conditions undermine trust in the process. Employees doubt whether payouts will be made as described. |
| Poorly designed bonus in any culture | Zero to negative productivity impact. Possible short-term retention of wrong employees. High cost relative to return. | Metric is outside employee control, payout timing is too distant, or the program is perceived as arbitrary. The program signals management’s values, not the employees’ opportunity. |
| No bonus program in a market where the benchmark exists | Above-market voluntary turnover. Difficulty attracting candidates in competitive markets. | In markets where bonus programs are the norm, their absence is perceived as a negative signal about the employer’s financial health or its valuation of the workforce. |
The conditions under which bonuses drive sustainable performance
Sustainable performance improvement from a bonus program requires three conditions to be true simultaneously. The metric must be within the employee’s control and directly observable. The payout must be proximate in time to the behavior that earned it. And the program must be applied consistently, so that employees trust that the reward will be made when the condition is met.
When all three are present, the bonus program functions as a continuous feedback mechanism: the employee performs a behavior, the behavior is measured, and the measurement produces a financial consequence within a timeframe that maintains the behavioral connection. This is the design the Dutch manufacturer used. Team output target, quarterly cycle, 30-day payment window.
Three bonus design failures that cost more than they return
Failure 1: Guaranteed bonuses
A bonus that is paid regardless of individual or team performance is a salary supplement with a variable label. It does not change behavior because the employee receives it whether they change behavior or not. It costs the same as a performance-linked bonus and produces none of the output or retention effects. Its only function is short-term attraction. Once in place, it is politically difficult to convert to a performance-linked structure without the affected employees perceiving a pay cut.
Failure 2: Company-wide profit sharing for non-leadership employees
Profit sharing tied to company-level financial results is not within the control of a warehouse operator, a junior accountant, or a customer service representative. The employee’s daily decisions have no visible connection to the metric that determines their bonus. The program is perceived as a benefit (good years produce a payment, bad years do not) rather than an incentive. Benefits affect satisfaction and attraction. They do not affect behavior.
Failure 3: Individual bonuses in roles that require collaboration
Placing individual performance bonuses on team-dependent roles creates a competition structure inside a collaboration environment. Employees optimize for their individual metric at the expense of the team outcome. In software development, this produces velocity optimization at the expense of code quality. In manufacturing, it produces unit-count optimization at the expense of defect rate. The bonus succeeds at its metric and fails at the business outcome.
A quick diagnostic: is your bonus program working?
Five questions, each answerable with data your Finance and HR teams already hold. Three or fewer yes answers indicate that the program requires redesign.
1. Has voluntary turnover among the target employee segment declined since the program launched, controlling for market conditions?
2. Has output per employee in the target team or function increased in the 12 months since launch, excluding external volume changes?
3. Can you attribute a specific behavior change to the program? Do employees describe changing their approach because of the incentive?
4. Is the total cost of the program, including social contributions and administration, lower than the value of the performance improvement plus the avoided replacement cost?
5. Do employees understand the program, including the metric, the payout timing, and the calculation? If asked to explain how the bonus is determined, would 80% of participants give the correct answer?
Achieving consistent employee bonus impact across multiple markets requires two things: a compensation design that matches the incentive to the outcome, and a payroll and compliance infrastructure that processes the program correctly. Missing either produces cost without result.
How Sunbytes connects compensation design to measurable business outcomes?
Sunbytes is a Dutch-founded technology and workforce company founded in 2011, with 300+ client projects delivered across 20+ countries and 15+ years operating in Vietnam.
Through Accelerate Workforce Solutions, Sunbytes provides EOR, temporary staffing, and payroll management for international companies in Vietnam and across EU markets. Bonus programs are configured in the payroll system from the first cycle. Social insurance contributions on bonus amounts are calculated correctly under Decree 143/2018/ND-CP for Vietnam and local statutory frameworks for EU markets. Employment contracts issued within 48 hours. Payroll on time every cycle. ISO 27001 certified. Signed Data Processing Agreement on every engagement aligned with GDPR Article 32.
Technical capability to build compensation analytics infrastructure.
For companies that need to measure bonus program ROI across multiple markets and employee segments, Digital Transformation Solutions builds the data architecture that connects payroll outputs to performance and attrition data. The measurement infrastructure is what makes the five-question diagnostic above answerable with data rather than approximation.
Data security across compensation and personal income records.
Bonus program data includes salary, performance ratings, and personal financial information. In European markets, GDPR Article 32 applies. In Vietnam, Decree 13/2023/ND-CP governs personal data processing. CyberSecurity Solutions embeds both frameworks into the compensation data handling process, so that cross-border bonus program management does not create a data liability alongside the performance one.
FAQs
Yes, conditionally. Gallup 2024 workplace research shows that engaged employees, including those whose engagement is driven by recognition and incentive programs, produce 18% higher productivity and 23% higher profitability than disengaged peers. The condition is design: the bonus must be tied to a metric within the employee’s control, paid close in time to the performance, and applied consistently.
A poorly designed bonus, one that rewards metrics outside employee control, pays too infrequently to drive behavior, or is perceived as arbitrary, produces no measurable performance effect. The budget is spent. The output does not change. The issue is not whether bonuses work. It is whether the specific design works.
WorldatWork 2024 data shows a median of 5.6% of total payroll for non-sales bonus programs. The range across industries is 2% to 12%, with technology and financial services at the high end and manufacturing and logistics below median.
The right percentage is the one that produces a positive return across the dimensions the company is trying to move. A 3% spend on a well-designed program with clear metric selection and proximate payout timing will outperform a 10% spend on a guaranteed annual payment that produces no behavioral change.
Retention bonuses with a defined cliff-vest structure, a payment made after 12 to 36 months of continuous employment, have the strongest direct retention effect for specific individuals. The payment size must be meaningful relative to the employee’s external market options to function as a genuine retention anchor. A retention bonus that is smaller than the first-month salary increase the employee would receive by moving creates no retention incentive.
For team-level retention, a quarterly team performance bonus produces stronger sustained retention than a single annual payment, because it creates four reinforcement cycles per year rather than one.
For routine or process-based tasks, higher financial incentives produce higher output up to a threshold. For cognitive or creative tasks, incentives above a moderate level can reduce performance by narrowing focus and increasing anxiety.
Over time, a bonus that was initially motivating can become baseline expectation. The impact of bonus on employee motivation follows a diminishing curve: after six consecutive quarterly cycles, employees begin to treat the payment as salary. The motivating effect diminishes and the retention effect converts from incentive to expectation. This is why bonus programs require periodic redesign rather than indefinite continuation in the same form.
The total cost has three components. Direct payout: the bonus amount paid to each eligible employee. Statutory contributions: employer social insurance contributions on the bonus amount (21.5% in Vietnam for contractual bonuses under Decree 143/2018/ND-CP; 20% to 25% in the Netherlands).
For a company with 50 employees and a 6.8% payroll bonus spent on a EUR 2,000,000 base, the direct payout is EUR 136,000. Internal administration for a quarterly program runs approximately 8 to 12 person-days per year (based on Sunbytes operational engagements 2024 to 2025). At a mid-level HR cost of EUR 400 per day across mid-market employers in EU markets, that adds EUR 3,200 to EUR 4,800. Total program cost: approximately EUR 169,000 to EUR 171,000 per year.
Let’s start with Sunbytes
Let us know your requirements for the team and we will contact you right away.